

Discover all the highlights!
Visualization with Power BI
Power BI from Microsoft is used more frequently and across a wider variety of scenarios than almost any other visualization tool. The all-round business intelligence tool can also be linked with the digital plant twin in Engineering Base. This allows the program to read development statuses and provide managers with informative status graphics as a basis for making decisions.
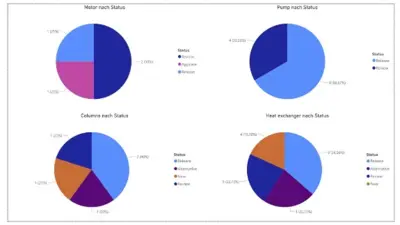
Data visualization made easy
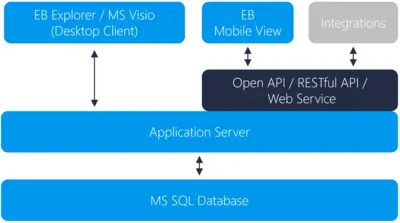
Visualization tools can seamlessly link up to Engineering Base and automatically extract all relevant data thanks to the web services and REST architecture. Automating this process saves resources. For one thing, it does away with time-consuming manual reading of data. And secondly, the automatically generated diagrams allow managers to reach decisions more efficiently based on real-time data.
Ability to integrate individual tools
A large number of other visualization tools exist besides Power BI. Do you use Tableau, QlikView, Google Data Studio, Domo, Looker or a genuinely niche solution? Contact our experienced integration team and it won't be long before you're managing your projects using up-to-date data straight from Engineering Base.